Working area
The O/D matrix in the study area used dates available on this site with other information. In the figure you can see the used network.
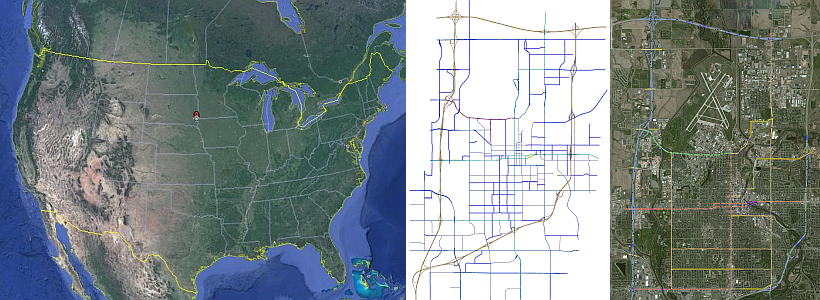
You can see precisely the study area via this link View area
Road network
With Tritone has been modeled the road network of the study area and the demand mobility. The data are freely available for download from this link. In this zip file you can read the real network in OpenStreetMap (you can open with JOSM java app), in Google Earth (you can open with Google Earth app) and other material.
![]()
To use is necessary to open them with the microsimulation software Tritone, available in this page.
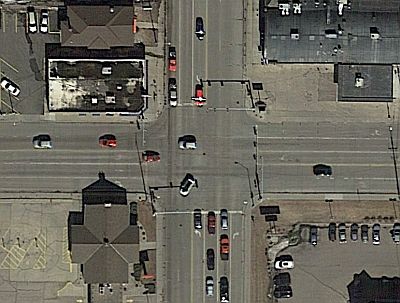
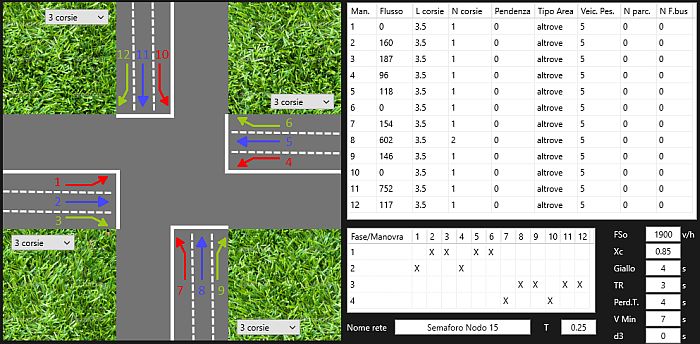
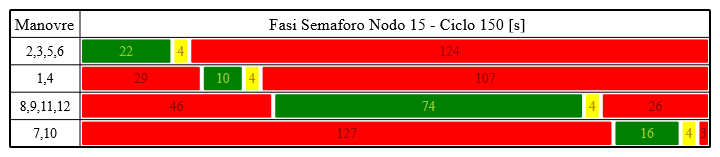
Traffic light
The network has only one traffic light in the node 15.
Vehicular trajectories
Through a simulation (of 3600 sec.) with the Wiedemann 99 car-following model and the presence of a GPS sensor on all vehicles (Mean 0 m, St.Dev. 5 m), these results were obtained.
- trajectories 0 – 6
- trajectories 7 – 13
- trajectories 14 – 20
- trajectories 21 – 27
- trajectories 28 – 60
- trajectories 61 – 90
- trajectories 91 – 120
- trajectories 121 – 160
You can convert the Triton trajectories files into Google Earth files with this app. The meaning of the columns can be seen in this file.