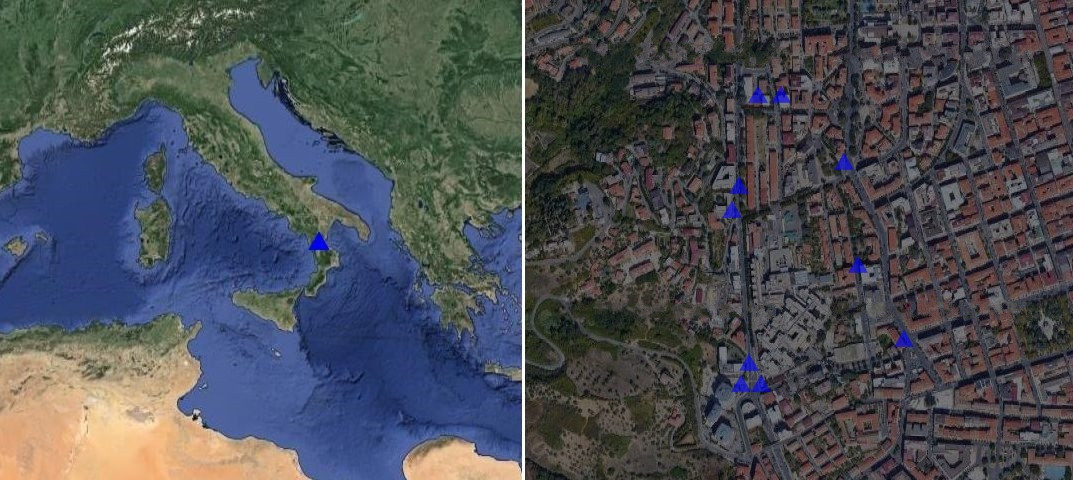
Working area
The O/D matrix in the study area was counted through a manual counting, and data are available on Rilievi Smart by permission. In the figure you can see the positions of the operators dedicated to counting. Year 2019.

You can see precisely the study area via this link View area or in the DWG map.
With Tritone has been modeled the road network of the study area and the demand mobility. The data are freely available for download from this link.
To use is necessary to open them with the microsimulation software Tritone, available in this page.
These are the solutions proposed for the area in question:
- Solution 1
- Solution 2
- Solution 3
- Solution 4
These are the presentations of the solutions:
- Solution 1
- Solution 2
- Solution 3
- Solution 4

